The hydrodynamic drag force exerted on a surfboard results in part from the frictional drag resulting from friction on the bottom of the surfboard in contact with the water.
The viscosity of a fluid describes the force binding its particles together. When a particle of a viscous fluid is set in motion, its neighbor is driven by viscosity, and conversely when a particle is slowed down, it slows down its neighboring particles. The viscosity of water is low compared to that of fluids like honey, but it is not zero. When the surfer picks up speed, the water particles in contact with the surface of the board stick to this surface, dragging their neighbors along. If we observe the velocities of the particles, by placing the surfboard as a fixed benchmark, we see that the particles in direct contact with the board are stationary and that the neighboring particles have a speed which increases up to to reach the speed of the overall fluid stream. The fluid zone disturbed by viscous friction is characterized by speeds lower than the general current, this disturbed zone is the boundary layer.
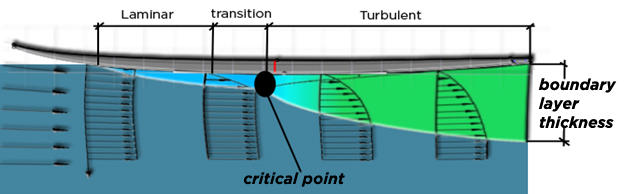
boundary layer generating friction drag (exaggerated thickness)
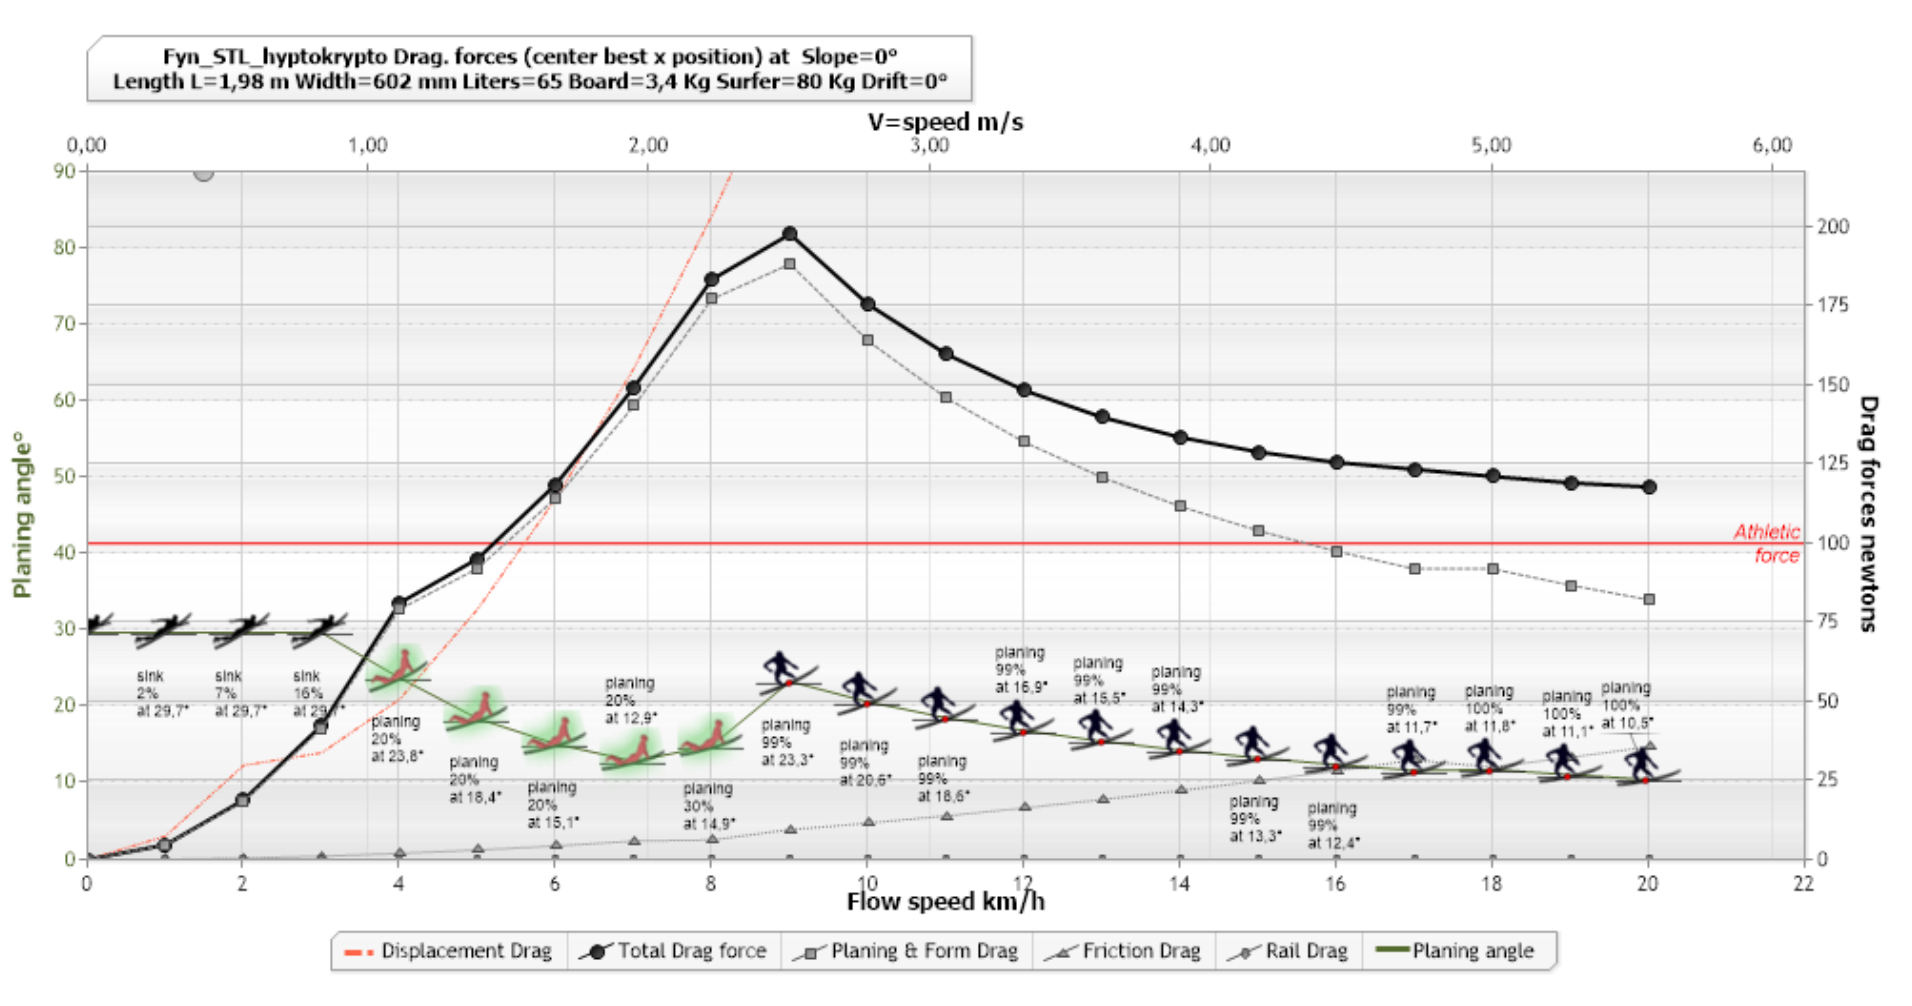
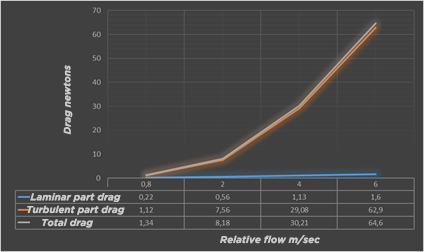
ShaperWaveDynamics software shows the frictional drag part (triangle points growings with speed) of the total hydrodynamics drag force on a surfboard:
The boundary layer determines the viscous friction drag as a function of the velocity and the length of the surface in contact with the fluid. The friction drag varies strongly according to the turbulence of the boundary layer, in the laminar zone it is very weak and in the turbulent zone it is stronger. The calculation of the friction drag force is therefore divided into 2 parts, the laminar layer and the turbulent layer. The objective here is not to detail these calculation methods, Let's use the Mecaflux software to establish an evaluation for different speeds of:
- Friction trails generated by the laminar and turbulent parts
- Distance from the critical point determining the transition from laminar to turbulent regime,
- Thickness of the boundary layer at the end of the board (useful to see the influence of the boundary layer on the fins)
Here is a series of calculations carried out in a range of speeds, going from the oar, 0.8 m/sec, up to a fast phase of 6 m/sec corresponding to wave speeds greater than 2 meters. We take as an example a long Board surface, 0.6 meters wide with a submerged part length of 2 meters, of which we estimate the wetted surface very approximately at 0.6*2=1.2 m²
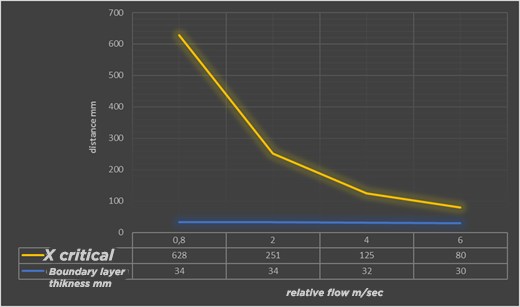
Evolution of boundary layer thickness and critical point distance as a function of relative velocity
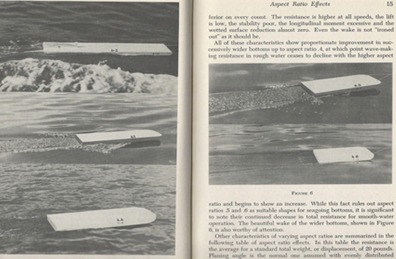
The thickness of the boundary layer (blue line) varies slightly and decreases with speed, it is approximately 30 mm at the end of the board. This decrease, even small, in thickness with speed may seem strange, it is illustrated in this aerodynamic experiment where we see that the turbulent boundary layer at high speed, follows the profile and takes off later than the laminar layer.
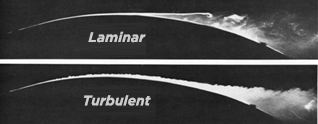
turbulent and laminar boundary layer comparisons (Renou, s.d.)
evolution of friction drag for a surface 0.6m wide and 2m long as a function of speed.
The frictional drag of the surface of our long Board of 1.2 m² therefore evolves from 1.3 to 64 newtons, it is mainly generated by the turbulent zone of the boundary layer. The critical point of transition from the laminar to turbulent zone benefits from being pushed back as far as possible. This distance is strongly impacted by roughness and surface defects that can initiate this detachment prematurely. A very smooth and scratch-free surface is valuable in the front part of the board. Then when the boundary layer is detached, the roughness loses its impact.
We will take advantage of this numerical analysis of the boundary layer with the Mecaflux software (MECAFLUX SOFTWARES, s.d.) to observe the impact of the width/length ratio on the boundary layer and the friction drag. We will use the ratios used by Lindsay Lord in his experimental analysis of planing hulls (LORD, 1946).
The choice of this experimental reference is part of our approach integrating the experience and work of shapers and surfers who have bequeathed to us surfing as we know it today. Bob Simmons is a reference in the history of shaping, drawing inspiration from the scientific and experimental work of Lindsay Lord in "Naval Architecture Of the Planing Hull" and other post-war aerodynamic references, he applied a reasoning scientific and experimental allowing major developments in surfing. He is often credited with being the inventor of the multifin, but his work on the role of surface ratio, documented by Lindsay Lord, and his work on rail profile, drawing on aerodynamic work published in "Theory of the Wing section” is the basis of current board shapes. His works, however, took 20 years after his death (1954) to be applied in the forms of boards on the market. The multi-fin was a way to bring more downforce to the rail, at a time when the single fin was very short and could "ventilate" in the vertical phases. We will see later, in the chapter on fins, how Greenought solved this problem while maintaining a single fin. Here are the experimental reference ratios and dimensions that we will use to harmonize our approach with the work of our predecessors.
Mecaflux 1 calculation dimensions: Width x Length plate at rest |
0.49*2.45= 1.2m² |
0.6*2= 1.2m² |
0.69*1.73 = 1.2 m² |
0.77*1.55= 1.2m² |
0.85*1.41= 1.2 m² |
Ratio= Width/ Length |
0.2 |
0.3 |
0.4 |
0.5 |
0.6 |
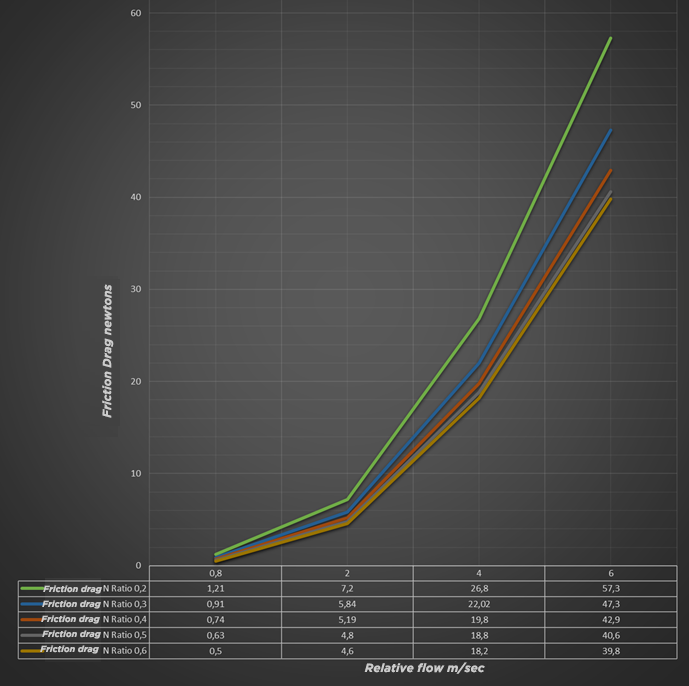
Calculs mecaflux 1 : variation épaisseur couche limite, et variation de traînée de frottement en fonction de la vitesse pour divers ratios d'une même surface. L'épaisseur de la couche limite augmente assez proportionnellement à la longueur de la planche. La traînée de frottement augmente elle aussi en fonction de la longueur, mais dans des proportions très faibles qui ne suivent pas l'augmentation de l'épaisseur de couche limite.
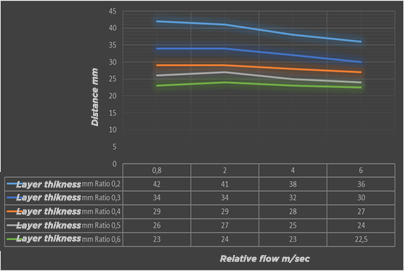
evolution of boundary layer thickness at the end of the board as a function of speeds and ratios( Mecaflux)
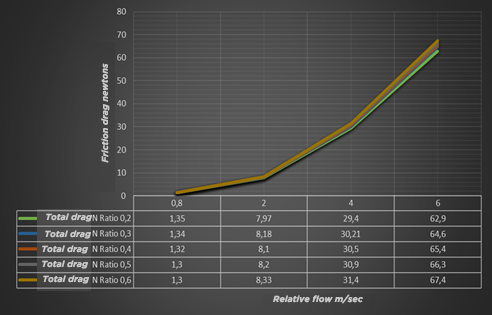
Evolution of frictional drag as a function of board Width/Length ratio and speed.. This above graph shows that the frictional drag evolves with the speed but that it is weakly impacted by the Width / Length ratio.
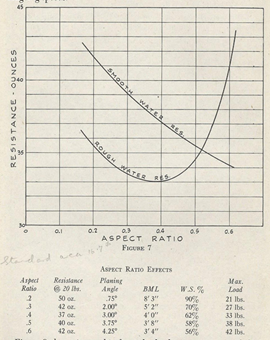
Global drag measurements of flat plates of various ratios (LORD, 1946)
Yet Lindsay Lord shows in her experiments that the overall drag (friction + shape drag also called pressure drag) is strongly impacted by this ratio. He observes that, in smooth water, wide boards (ratio 0.6) generate less overall drag than narrow boards (ratio 0.2). Note in passing that the trend of drag reduction is reversed when the water becomes choppy: a wide board seems more sensitive to chop and loses its advantage when the surface of the water is disturbed. The versatile compromise being around 0.5. This ratio of 0.5 is taken up by Ryan Burch in 2009 in a cut foam bar simply coated with a black coating, to show how the simplest form with an optimal ratio is capable of speed and maneuverability:
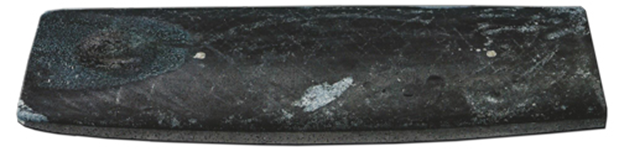
Ryan Burch 2009 surf board ratio 0.5 Lindsay Lord Planning Hull (Kenvin, s.d.)
In his book (LORD, 1946) Lindsay Lord takes care to give us, in addition to the ratio, the wetted surface varying according to the planing angle observed in her experiments. He points out that the surface ratio modifies the planing angle (Pla-ning angle in the previous graph) for a given load, and that this planing angle modifies the wetted surface (WS% in the previous graph) whose reduction decreases friction drag.
Ratio= Width/ Length |
0.2 |
0.3 |
0.4 |
0.5 |
0.6 |
Dimensions mecaflux calcul 1: Width x Length plate |
0.49*2.45 = 1.2m² |
0.6*2 = 1.2m² |
0.69*1.73 = 1.2 m² |
0.77*1.55 = 1.2m² |
0.85*1.41= 1.2 m² |
Wet surface observed from (LORD, 1946) |
90%=1.08m² |
70%=0.84 m² |
62%=0.74 m² |
58%=0.69m² |
56%=0.67 m² |
Dimensions calculs mecaflux 2 : Width x Wet length |
0.49*2.20= 1.08m² |
0.6*1.4= 0.84m² |
0.69*1.07= 0.74 m² |
0.77*0.89= 0.69m² |
0.85*0.78= 0.67 m² |
Drag (approximate in Newtons) observed for a load (displacement) of 9 kg according to (LORD, 1946) |
14,17 |
11,90 |
10,478 |
11,33 |
11,90 |
By performing the friction drag calculations again for the various ratios, but integrating a modified wetted surface following Lindsay Lord's observations, it is shown that the frictional drag decreases with the wetted surface.
We can however notice that the weakest drag observed by Lindsay Lord is at the level of the 0.4 ratio while the calculations designate the 0.6 ratio as being the least energy consuming in terms of friction. This difference is explained by the increase in shape drag generated by the increase in the frontal surface opposed to the flow, caused by the increase in the angle of incidence observed for a fixed center of gravity. This of course did not escape Lindsay Lord who advocates moving the center of gravity forward to restore a trim reducing the frontal surface and the angle of incidence. This does not escape the intuition of the surfer who is looking for the best rowing position, or the sailor who moves forward of his dinghy to get it on plane. But beyond certain speeds, we will see that the friction becomes predominant and that the placement benefits from coming back to the rear to reduce the friction surface.
We will therefore conclude our reflection on the impact of frictional drag and surface area ratio with the following observation:
• Width is a performance factor in terms of friction drag reduction because it decreases the wetted area when planing.
• This contribution becomes less substantial from the 0.5 ratio and even counterproductive in choppy conditions.
• A large width will be fully exploited by moving the center of gravity forward to restore a low angle of attack, resulting in a wide point position designed for this acceleration by forward support.
We will add that this friction drag estimation exercise could have been greatly simplified with the ShaperWaveDynamics software, which establishes the optimal planing angle and wetted surface to produce the friction drag+shape drag graphs as a function of a given board: See: Hydrodynamic surf drag